_________________________________________________________________________________________________________
CONCLUSION
_________________________________________________________________________________________________________
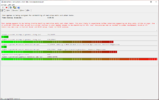
Your system appears to be having trouble handling real-time audio and other tasks. You are likely to experience buffer underruns appearing as drop outs, clicks or pops. One or more DPC routines that belong to a driver running in your system appear to be executing for too long. At least one detected problem appears to be network related. In case you are using a WLAN adapter, try disabling it to get better results. One problem may be related to power management, disable CPU throttling settings in Control Panel and BIOS setup. Check for BIOS updates.
LatencyMon has been analyzing your system for 0:35:42 (h:mm:ss) on all processors.
_________________________________________________________________________________________________________
SYSTEM INFORMATION
_________________________________________________________________________________________________________
Computer name: DESKTOP-IMOACES
OS version: Windows 8 , 6.2, build: 9200 (x64)
Hardware: Z170-Gaming K3, Gigabyte Technology Co., Ltd., Z170-Gaming K3-CF
CPU: GenuineIntel Intel(R) Core(TM) i7-6700K CPU @ 4.00GHz
Logical processors: 8
Processor groups: 1
RAM: 16267 MB total
_________________________________________________________________________________________________________
CPU SPEED
_________________________________________________________________________________________________________
Reported CPU speed: 4008,0 MHz
Measured CPU speed: 4233,0 MHz (approx.)
Note: reported execution times may be calculated based on a fixed reported CPU speed. Disable variable speed settings like Intel Speed Step and AMD Cool N Quiet in the BIOS setup for more accurate results.
_________________________________________________________________________________________________________
MEASURED INTERRUPT TO USER PROCESS LATENCIES
_________________________________________________________________________________________________________
The interrupt to process latency reflects the measured interval that a usermode process needed to respond to a hardware request from the moment the interrupt service routine started execution. This includes the scheduling and execution of a DPC routine, the signaling of an event and the waking up of a usermode thread from an idle wait state in response to that event.
Highest measured interrupt to process latency (µs): 4090,379764
Average measured interrupt to process latency (µs): 3,494411
Highest measured interrupt to DPC latency (µs): 4066,363793
Average measured interrupt to DPC latency (µs): 0,770148
_________________________________________________________________________________________________________
REPORTED ISRs
_________________________________________________________________________________________________________
Interrupt service routines are routines installed by the OS and device drivers that execute in response to a hardware interrupt signal.
Highest ISR routine execution time (µs): 94,603044
Driver with highest ISR routine execution time: ndis.sys - NDIS (Network Driver Interface Specification), Microsoft Corporation
Highest reported total ISR routine time (%): 0,006016
Driver with highest ISR total time: ndis.sys - NDIS (Network Driver Interface Specification), Microsoft Corporation
Total time spent in ISRs (%) 0,009908
ISR count (execution time <250 µs): 537099
ISR count (execution time 250-500 µs): 0
ISR count (execution time 500-999 µs): 0
ISR count (execution time 1000-1999 µs): 0
ISR count (execution time 2000-3999 µs): 0
ISR count (execution time >=4000 µs): 0
_________________________________________________________________________________________________________
REPORTED DPCs
_________________________________________________________________________________________________________
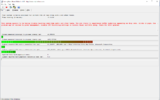
DPC routines are part of the interrupt servicing dispatch mechanism and disable the possibility for a process to utilize the CPU while it is interrupted until the DPC has finished execution.
Highest DPC routine execution time (µs): 3957,859032
Driver with highest DPC routine execution time: ndis.sys - NDIS (Network Driver Interface Specification), Microsoft Corporation
Highest reported total DPC routine time (%): 0,043078
Driver with highest DPC total execution time: ndis.sys - NDIS (Network Driver Interface Specification), Microsoft Corporation
Total time spent in DPCs (%) 0,115596
DPC count (execution time <250 µs): 4544073
DPC count (execution time 250-500 µs): 0
DPC count (execution time 500-999 µs): 49
DPC count (execution time 1000-1999 µs): 4
DPC count (execution time 2000-3999 µs): 3
DPC count (execution time >=4000 µs): 0
_________________________________________________________________________________________________________
REPORTED HARD PAGEFAULTS
_________________________________________________________________________________________________________
Hard pagefaults are events that get triggered by making use of virtual memory that is not resident in RAM but backed by a memory mapped file on disk. The process of resolving the hard pagefault requires reading in the memory from disk while the process is interrupted and blocked from execution.
Process with highest pagefault count: none
Total number of hard pagefaults 0
Hard pagefault count of hardest hit process: 0
Highest hard pagefault resolution time (µs): 0,0
Total time spent in hard pagefaults (%): 0,0
Number of processes hit: 0
_________________________________________________________________________________________________________
PER CPU DATA
_________________________________________________________________________________________________________
CPU 0 Interrupt cycle time (s): 52,54440
CPU 0 ISR highest execution time (µs): 94,603044
CPU 0 ISR total execution time (s): 1,695284
CPU 0 ISR count: 535346
CPU 0 DPC highest execution time (µs): 503,899202
CPU 0 DPC total execution time (s): 10,725662
CPU 0 DPC count: 3672584
_________________________________________________________________________________________________________
CPU 1 Interrupt cycle time (s): 40,345643
CPU 1 ISR highest execution time (µs): 53,671158
CPU 1 ISR total execution time (s): 0,003051
CPU 1 ISR count: 1738
CPU 1 DPC highest execution time (µs): 194,285180
CPU 1 DPC total execution time (s): 0,523189
CPU 1 DPC count: 67417
_________________________________________________________________________________________________________
CPU 2 Interrupt cycle time (s): 23,940444
CPU 2 ISR highest execution time (µs): 35,779441
CPU 2 ISR total execution time (s): 0,000064
CPU 2 ISR count: 15
CPU 2 DPC highest execution time (µs): 3957,859032
CPU 2 DPC total execution time (s): 4,543570
CPU 2 DPC count: 301454
_________________________________________________________________________________________________________
CPU 3 Interrupt cycle time (s): 35,487417
CPU 3 ISR highest execution time (µs): 0,0
CPU 3 ISR total execution time (s): 0,0
CPU 3 ISR count: 0
CPU 3 DPC highest execution time (µs): 313,170160
CPU 3 DPC total execution time (s): 0,401122
CPU 3 DPC count: 61289
_________________________________________________________________________________________________________
CPU 4 Interrupt cycle time (s): 18,643628
CPU 4 ISR highest execution time (µs): 0,0
CPU 4 ISR total execution time (s): 0,0
CPU 4 ISR count: 0
CPU 4 DPC highest execution time (µs): 468,411178
CPU 4 DPC total execution time (s): 1,118164
CPU 4 DPC count: 146804
_________________________________________________________________________________________________________
CPU 5 Interrupt cycle time (s): 35,057677
CPU 5 ISR highest execution time (µs): 0,0
CPU 5 ISR total execution time (s): 0,0
CPU 5 ISR count: 0
CPU 5 DPC highest execution time (µs): 238,697355
CPU 5 DPC total execution time (s): 0,467861
CPU 5 DPC count: 61435
_________________________________________________________________________________________________________
CPU 6 Interrupt cycle time (s): 21,099520
CPU 6 ISR highest execution time (µs): 0,0
CPU 6 ISR total execution time (s): 0,0
CPU 6 ISR count: 0
CPU 6 DPC highest execution time (µs): 1168,506238
CPU 6 DPC total execution time (s): 1,511652
CPU 6 DPC count: 166645
_________________________________________________________________________________________________________
CPU 7 Interrupt cycle time (s): 37,129026
CPU 7 ISR highest execution time (µs): 0,0
CPU 7 ISR total execution time (s): 0,0
CPU 7 ISR count: 0
CPU 7 DPC highest execution time (µs): 295,659182
CPU 7 DPC total execution time (s): 0,523678
CPU 7 DPC count: 66501
_________________________________________________________________________________________________________