PROBLEMA Scheda audio a singhiozzi

Pubblicità
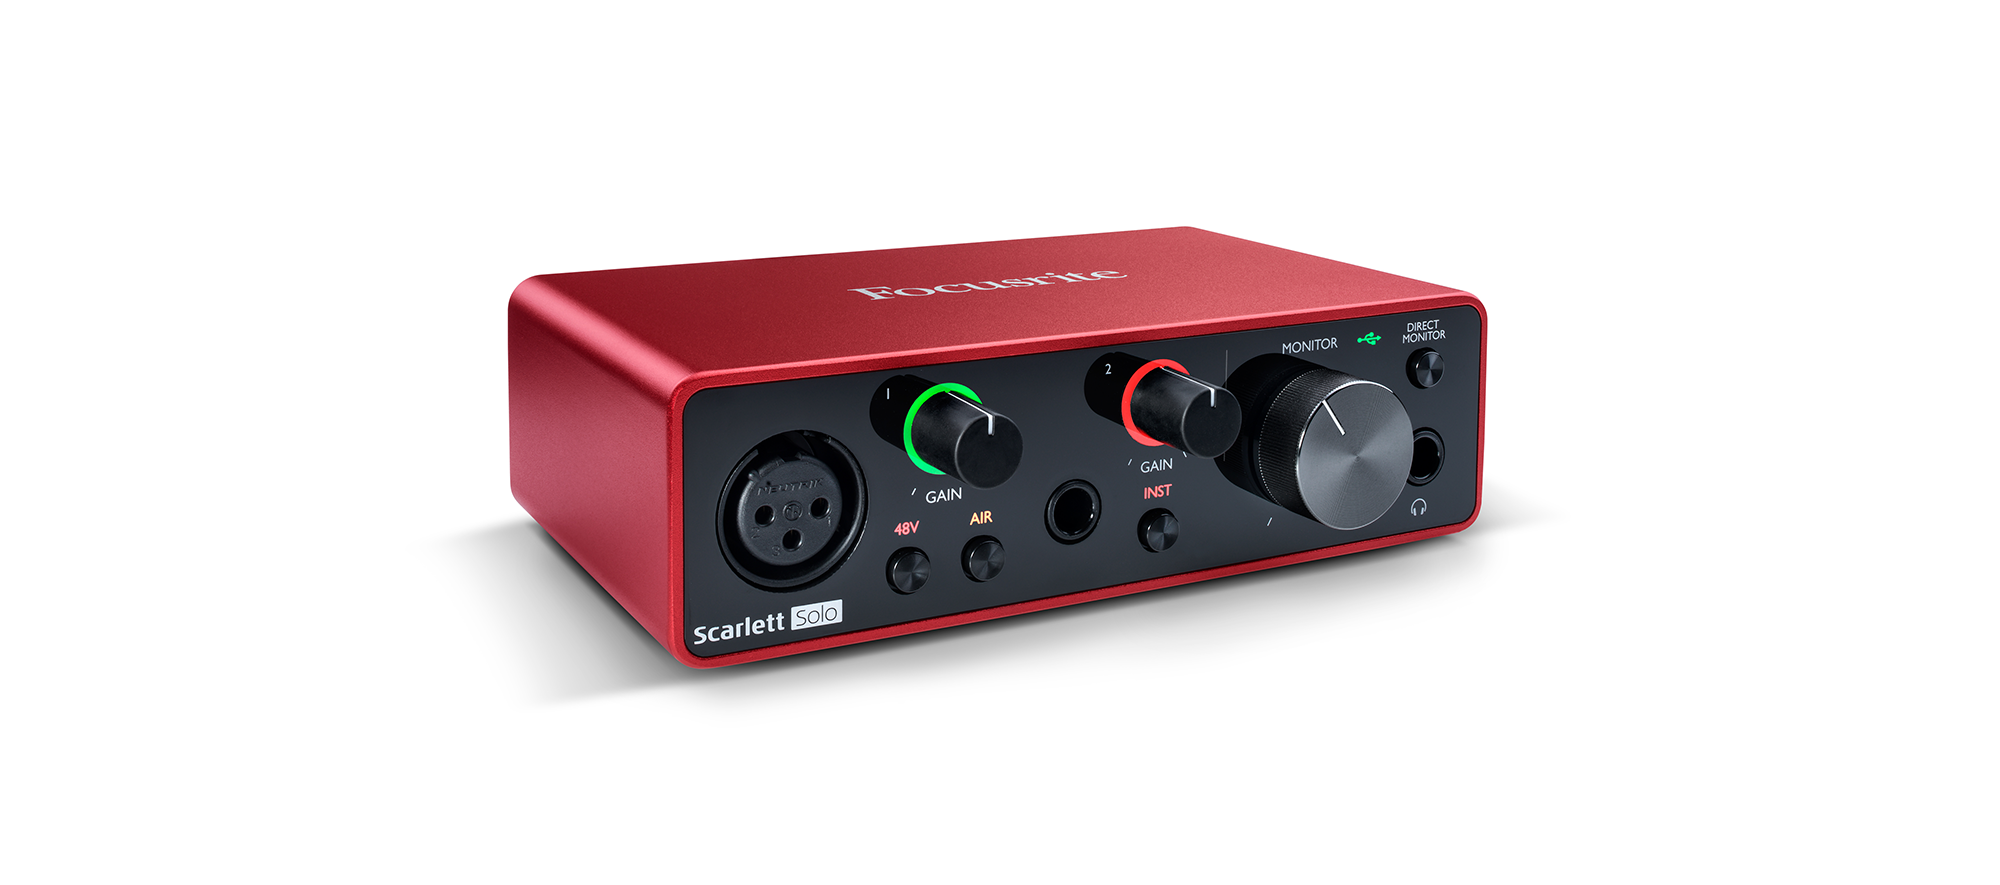
Che scheda audio è? Focusrite che modello? Come è collegata al pc?

Focusrite solo 3Gen collegata tramite usb classico - uscb c
Premetto che per circa 1 anno di vita non mi ha dato problemi e che in fase di test ho rimosso ogni usb ad eccezione di mouse e tastiera
 
Ho reinstallato e fatto partire latencymon;

_________________________________________________________________________________________________________
CONCLUSION
_________________________________________________________________________________________________________
Your system appears to be having trouble handling real-time audio and other tasks. You are likely to experience buffer underruns appearing as drop outs, clicks or pops. One problem may be related to power management, disable CPU throttling settings in Control Panel and BIOS setup. Check for BIOS updates.
LatencyMon has been analyzing your system for 0:02:58 (h:mm:ss) on all processors.


_________________________________________________________________________________________________________
SYSTEM INFORMATION
_________________________________________________________________________________________________________
Computer name: DESKTOP-7G6T94E
OS version: Windows 10, 10.0, version 2009, build: 19045 (x64)
Hardware: System Product Name, ASUS
BIOS: 2701
CPU: GenuineIntel Intel(R) Core(TM) i7-10700K CPU @ 3.80GHz
Logical processors: 16
Processor groups: 1
Processor group size: 16
RAM: 32668 MB total


_________________________________________________________________________________________________________
CPU SPEED
_________________________________________________________________________________________________________
Reported CPU speed (WMI): 3792 MHz
Reported CPU speed (registry): 3792 MHz

Note: reported execution times may be calculated based on a fixed reported CPU speed. Disable variable speed settings like Intel Speed Step and AMD Cool N Quiet in the BIOS setup for more accurate results.


_________________________________________________________________________________________________________
MEASURED INTERRUPT TO USER PROCESS LATENCIES
_________________________________________________________________________________________________________
The interrupt to process latency reflects the measured interval that a usermode process needed to respond to a hardware request from the moment the interrupt service routine started execution. This includes the scheduling and execution of a DPC routine, the signaling of an event and the waking up of a usermode thread from an idle wait state in response to that event.

Highest measured interrupt to process latency (µs): 2098,10
Average measured interrupt to process latency (µs): 4,583485

Highest measured interrupt to DPC latency (µs): 2095,30
Average measured interrupt to DPC latency (µs): 2,198919


_________________________________________________________________________________________________________
REPORTED ISRs
_________________________________________________________________________________________________________
Interrupt service routines are routines installed by the OS and device drivers that execute in response to a hardware interrupt signal.

Highest ISR routine execution time (µs): 63,370781
Driver with highest ISR routine execution time: HDAudBus.sys - High Definition Audio Bus Driver, Microsoft Corporation

Highest reported total ISR routine time (%): 0,000821
Driver with highest ISR total time: HDAudBus.sys - High Definition Audio Bus Driver, Microsoft Corporation

Total time spent in ISRs (%) 0,001148

ISR count (execution time <250 µs): 17093
ISR count (execution time 250-500 µs): 0
ISR count (execution time 500-1000 µs): 0
ISR count (execution time 1000-2000 µs): 0
ISR count (execution time 2000-4000 µs): 0
ISR count (execution time >=4000 µs): 0


_________________________________________________________________________________________________________
REPORTED DPCs
_________________________________________________________________________________________________________
DPC routines are part of the interrupt servicing dispatch mechanism and disable the possibility for a process to utilize the CPU while it is interrupted until the DPC has finished execution.

Highest DPC routine execution time (µs): 618,223101
Driver with highest DPC routine execution time: nvlddmkm.sys - NVIDIA Windows Kernel Mode Driver, Version 536.40 , NVIDIA Corporation

Highest reported total DPC routine time (%): 0,059694
Driver with highest DPC total execution time: dxgkrnl.sys - DirectX Graphics Kernel, Microsoft Corporation

Total time spent in DPCs (%) 0,131511

DPC count (execution time <250 µs): 567437
DPC count (execution time 250-500 µs): 0
DPC count (execution time 500-10000 µs): 40
DPC count (execution time 1000-2000 µs): 0
DPC count (execution time 2000-4000 µs): 0
DPC count (execution time >=4000 µs): 0


_________________________________________________________________________________________________________
REPORTED HARD PAGEFAULTS
_________________________________________________________________________________________________________
Hard pagefaults are events that get triggered by making use of virtual memory that is not resident in RAM but backed by a memory mapped file on disk. The process of resolving the hard pagefault requires reading in the memory from disk while the process is interrupted and blocked from execution.

NOTE: some processes were hit by hard pagefaults. If these were programs producing audio, they are likely to interrupt the audio stream resulting in dropouts, clicks and pops. Check the Processes tab to see which programs were hit.

Process with highest pagefault count: fifa23.exe

Total number of hard pagefaults 127620
Hard pagefault count of hardest hit process: 104997
Number of processes hit: 69


_________________________________________________________________________________________________________
PER CPU DATA
_________________________________________________________________________________________________________
CPU 0 Interrupt cycle time (s): 11,093287
CPU 0 ISR highest execution time (µs): 45,733122
CPU 0 ISR total execution time (s): 0,007288
CPU 0 ISR count: 3617
CPU 0 DPC highest execution time (µs): 618,223101
CPU 0 DPC total execution time (s): 3,381096
CPU 0 DPC count: 489531
_________________________________________________________________________________________________________
CPU 1 Interrupt cycle time (s): 1,869335
CPU 1 ISR highest execution time (µs): 63,370781
CPU 1 ISR total execution time (s): 0,022878
CPU 1 ISR count: 9830
CPU 1 DPC highest execution time (µs): 121,198840
CPU 1 DPC total execution time (s): 0,143671
CPU 1 DPC count: 12560
_________________________________________________________________________________________________________
CPU 2 Interrupt cycle time (s): 1,101510
CPU 2 ISR highest execution time (µs): 9,910865
CPU 2 ISR total execution time (s): 0,000325
CPU 2 ISR count: 154
CPU 2 DPC highest execution time (µs): 299,939346
CPU 2 DPC total execution time (s): 0,019717
CPU 2 DPC count: 6997
_________________________________________________________________________________________________________
CPU 3 Interrupt cycle time (s): 1,156191
CPU 3 ISR highest execution time (µs): 0,0
CPU 3 ISR total execution time (s): 0,0
CPU 3 ISR count: 0
CPU 3 DPC highest execution time (µs): 53,899789
CPU 3 DPC total execution time (s): 0,012894
CPU 3 DPC count: 4182
_________________________________________________________________________________________________________
CPU 4 Interrupt cycle time (s): 1,696641
CPU 4 ISR highest execution time (µs): 0,0
CPU 4 ISR total execution time (s): 0,0
CPU 4 ISR count: 0
CPU 4 DPC highest execution time (µs): 159,264768
CPU 4 DPC total execution time (s): 0,041359
CPU 4 DPC count: 10955
_________________________________________________________________________________________________________
CPU 5 Interrupt cycle time (s): 1,063723
CPU 5 ISR highest execution time (µs): 0,0
CPU 5 ISR total execution time (s): 0,0
CPU 5 ISR count: 0
CPU 5 DPC highest execution time (µs): 87,324895
CPU 5 DPC total execution time (s): 0,005509
CPU 5 DPC count: 1825
_________________________________________________________________________________________________________
CPU 6 Interrupt cycle time (s): 1,074467
CPU 6 ISR highest execution time (µs): 0,0
CPU 6 ISR total execution time (s): 0,0
CPU 6 ISR count: 0
CPU 6 DPC highest execution time (µs): 88,101793
CPU 6 DPC total execution time (s): 0,014771
CPU 6 DPC count: 5306
_________________________________________________________________________________________________________
CPU 7 Interrupt cycle time (s): 1,014123
CPU 7 ISR highest execution time (µs): 0,0
CPU 7 ISR total execution time (s): 0,0
CPU 7 ISR count: 0
CPU 7 DPC highest execution time (µs): 95,485232
CPU 7 DPC total execution time (s): 0,005786
CPU 7 DPC count: 2080
_________________________________________________________________________________________________________
CPU 8 Interrupt cycle time (s): 1,028521
CPU 8 ISR highest execution time (µs): 0,0
CPU 8 ISR total execution time (s): 0,0
CPU 8 ISR count: 0
CPU 8 DPC highest execution time (µs): 298,213080
CPU 8 DPC total execution time (s): 0,014229
CPU 8 DPC count: 4760
_________________________________________________________________________________________________________
CPU 9 Interrupt cycle time (s): 1,206555
CPU 9 ISR highest execution time (µs): 0,0
CPU 9 ISR total execution time (s): 0,0
CPU 9 ISR count: 0
CPU 9 DPC highest execution time (µs): 297,811709
CPU 9 DPC total execution time (s): 0,023148
CPU 9 DPC count: 5948
_________________________________________________________________________________________________________
CPU 10 Interrupt cycle time (s): 1,026988
CPU 10 ISR highest execution time (µs): 0,0
CPU 10 ISR total execution time (s): 0,0
CPU 10 ISR count: 0
CPU 10 DPC highest execution time (µs): 298,939346
CPU 10 DPC total execution time (s): 0,016438
CPU 10 DPC count: 5603
_________________________________________________________________________________________________________
CPU 11 Interrupt cycle time (s): 1,029327
CPU 11 ISR highest execution time (µs): 0,0
CPU 11 ISR total execution time (s): 0,0
CPU 11 ISR count: 0
CPU 11 DPC highest execution time (µs): 156,187764
CPU 11 DPC total execution time (s): 0,008020
CPU 11 DPC count: 2246
_________________________________________________________________________________________________________
CPU 12 Interrupt cycle time (s): 1,309212
CPU 12 ISR highest execution time (µs): 2,667722
CPU 12 ISR total execution time (s): 0,001156
CPU 12 ISR count: 1644
CPU 12 DPC highest execution time (µs): 298,186709
CPU 12 DPC total execution time (s): 0,027026
CPU 12 DPC count: 6750
_________________________________________________________________________________________________________
CPU 13 Interrupt cycle time (s): 1,114930
CPU 13 ISR highest execution time (µs): 3,315928
CPU 13 ISR total execution time (s): 0,000910
CPU 13 ISR count: 1547
CPU 13 DPC highest execution time (µs): 143,633439
CPU 13 DPC total execution time (s): 0,006338
CPU 13 DPC count: 1957
_________________________________________________________________________________________________________
CPU 14 Interrupt cycle time (s): 1,139541
CPU 14 ISR highest execution time (µs): 1,421941
CPU 14 ISR total execution time (s): 0,000031
CPU 14 ISR count: 34
CPU 14 DPC highest execution time (µs): 183,864979
CPU 14 DPC total execution time (s): 0,020720
CPU 14 DPC count: 5131
_________________________________________________________________________________________________________
CPU 15 Interrupt cycle time (s): 1,175476
CPU 15 ISR highest execution time (µs): 1,274262
CPU 15 ISR total execution time (s): 0,000158
CPU 15 ISR count: 267
CPU 15 DPC highest execution time (µs): 111,522679
CPU 15 DPC total execution time (s): 0,009332
CPU 15 DPC count: 1646
_________________________________________________________________________________________________________
Ma quanti programmi hai in avvio che girano in backgroud?
 
Devo provare ad avviare il test chiudendo tutto?
In precedenza lo eseguivo all'avvio del pc e ho davvero poca roba che si avvia con windows
In App in Avvio da gestione attività disabilita tutto tranne l'antivirus e riavvia il pc e poi avvia il test
 
In App in Avvio da gestione attività disabilita tutto tranne l'antivirus e riavvia il pc e poi avvia il test

Ho disabilitato tutto all'avvio, di seguito il report.

_________________________________________________________________________________________________________
CONCLUSION
_________________________________________________________________________________________________________
Your system seems to be having difficulty handling real-time audio and other tasks. You may experience drop outs, clicks or pops due to buffer underruns. One or more DPC routines that belong to a driver running in your system appear to be executing for too long. One problem may be related to power management, disable CPU throttling settings in Control Panel and BIOS setup. Check for BIOS updates.
LatencyMon has been analyzing your system for 0:21:28 (h:mm:ss) on all processors.


_________________________________________________________________________________________________________
SYSTEM INFORMATION
_________________________________________________________________________________________________________
Computer name: DESKTOP-7G6T94E
OS version: Windows 10, 10.0, version 2009, build: 19045 (x64)
Hardware: System Product Name, ASUS
BIOS: 2701
CPU: GenuineIntel Intel(R) Core(TM) i7-10700K CPU @ 3.80GHz
Logical processors: 16
Processor groups: 1
Processor group size: 16
RAM: 32668 MB total


_________________________________________________________________________________________________________
CPU SPEED
_________________________________________________________________________________________________________
Reported CPU speed (WMI): 3792 MHz
Reported CPU speed (registry): 3792 MHz

Note: reported execution times may be calculated based on a fixed reported CPU speed. Disable variable speed settings like Intel Speed Step and AMD Cool N Quiet in the BIOS setup for more accurate results.


_________________________________________________________________________________________________________
MEASURED INTERRUPT TO USER PROCESS LATENCIES
_________________________________________________________________________________________________________
The interrupt to process latency reflects the measured interval that a usermode process needed to respond to a hardware request from the moment the interrupt service routine started execution. This includes the scheduling and execution of a DPC routine, the signaling of an event and the waking up of a usermode thread from an idle wait state in response to that event.

Highest measured interrupt to process latency (µs): 619,30
Average measured interrupt to process latency (µs): 6,641602

Highest measured interrupt to DPC latency (µs): 535,80
Average measured interrupt to DPC latency (µs): 2,207776


_________________________________________________________________________________________________________
REPORTED ISRs
_________________________________________________________________________________________________________
Interrupt service routines are routines installed by the OS and device drivers that execute in response to a hardware interrupt signal.

Highest ISR routine execution time (µs): 587,232068
Driver with highest ISR routine execution time: Wdf01000.sys - Runtime framework driver modalità kernel, Microsoft Corporation

Highest reported total ISR routine time (%): 0,001288
Driver with highest ISR total time: Wdf01000.sys - Runtime framework driver modalità kernel, Microsoft Corporation

Total time spent in ISRs (%) 0,002106

ISR count (execution time <250 µs): 293482
ISR count (execution time 250-500 µs): 0
ISR count (execution time 500-1000 µs): 10
ISR count (execution time 1000-2000 µs): 0
ISR count (execution time 2000-4000 µs): 0
ISR count (execution time >=4000 µs): 0


_________________________________________________________________________________________________________
REPORTED DPCs
_________________________________________________________________________________________________________
DPC routines are part of the interrupt servicing dispatch mechanism and disable the possibility for a process to utilize the CPU while it is interrupted until the DPC has finished execution.

Highest DPC routine execution time (µs): 1100,373418
Driver with highest DPC routine execution time: Wdf01000.sys - Runtime framework driver modalità kernel, Microsoft Corporation

Highest reported total DPC routine time (%): 0,037478
Driver with highest DPC total execution time: nvlddmkm.sys - NVIDIA Windows Kernel Mode Driver, Version 536.40 , NVIDIA Corporation

Total time spent in DPCs (%) 0,098172

DPC count (execution time <250 µs): 2257983
DPC count (execution time 250-500 µs): 0
DPC count (execution time 500-10000 µs): 1347
DPC count (execution time 1000-2000 µs): 22
DPC count (execution time 2000-4000 µs): 0
DPC count (execution time >=4000 µs): 0


_________________________________________________________________________________________________________
REPORTED HARD PAGEFAULTS
_________________________________________________________________________________________________________
Hard pagefaults are events that get triggered by making use of virtual memory that is not resident in RAM but backed by a memory mapped file on disk. The process of resolving the hard pagefault requires reading in the memory from disk while the process is interrupted and blocked from execution.

NOTE: some processes were hit by hard pagefaults. If these were programs producing audio, they are likely to interrupt the audio stream resulting in dropouts, clicks and pops. Check the Processes tab to see which programs were hit.

Process with highest pagefault count: steam.exe

Total number of hard pagefaults 21107
Hard pagefault count of hardest hit process: 4745
Number of processes hit: 67


_________________________________________________________________________________________________________
PER CPU DATA
_________________________________________________________________________________________________________
CPU 0 Interrupt cycle time (s): 91,706384
CPU 0 ISR highest execution time (µs): 559,463608
CPU 0 ISR total execution time (s): 0,386970
CPU 0 ISR count: 228250
CPU 0 DPC highest execution time (µs): 1100,373418
CPU 0 DPC total execution time (s): 19,697922
CPU 0 DPC count: 2157006
_________________________________________________________________________________________________________
CPU 1 Interrupt cycle time (s): 43,672558
CPU 1 ISR highest execution time (µs): 533,353376
CPU 1 ISR total execution time (s): 0,011065
CPU 1 ISR count: 6835
CPU 1 DPC highest execution time (µs): 570,507384
CPU 1 DPC total execution time (s): 0,161646
CPU 1 DPC count: 10814
_________________________________________________________________________________________________________
CPU 2 Interrupt cycle time (s): 21,290998
CPU 2 ISR highest execution time (µs): 22,517405
CPU 2 ISR total execution time (s): 0,000298
CPU 2 ISR count: 42
CPU 2 DPC highest execution time (µs): 558,720992
CPU 2 DPC total execution time (s): 0,077679
CPU 2 DPC count: 28258
_________________________________________________________________________________________________________
CPU 3 Interrupt cycle time (s): 22,969662
CPU 3 ISR highest execution time (µs): 0,0
CPU 3 ISR total execution time (s): 0,0
CPU 3 ISR count: 0
CPU 3 DPC highest execution time (µs): 582,347046
CPU 3 DPC total execution time (s): 0,007737
CPU 3 DPC count: 1986
_________________________________________________________________________________________________________
CPU 4 Interrupt cycle time (s): 29,818571
CPU 4 ISR highest execution time (µs): 0,0
CPU 4 ISR total execution time (s): 0,0
CPU 4 ISR count: 0
CPU 4 DPC highest execution time (µs): 577,303797
CPU 4 DPC total execution time (s): 0,036760
CPU 4 DPC count: 8521
_________________________________________________________________________________________________________
CPU 5 Interrupt cycle time (s): 30,037493
CPU 5 ISR highest execution time (µs): 0,0
CPU 5 ISR total execution time (s): 0,0
CPU 5 ISR count: 0
CPU 5 DPC highest execution time (µs): 110,270042
CPU 5 DPC total execution time (s): 0,004241
CPU 5 DPC count: 870
_________________________________________________________________________________________________________
CPU 6 Interrupt cycle time (s): 38,302247
CPU 6 ISR highest execution time (µs): 0,0
CPU 6 ISR total execution time (s): 0,0
CPU 6 ISR count: 0
CPU 6 DPC highest execution time (µs): 583,437236
CPU 6 DPC total execution time (s): 0,032985
CPU 6 DPC count: 7363
_________________________________________________________________________________________________________
CPU 7 Interrupt cycle time (s): 36,453227
CPU 7 ISR highest execution time (µs): 0,0
CPU 7 ISR total execution time (s): 0,0
CPU 7 ISR count: 0
CPU 7 DPC highest execution time (µs): 582,265823
CPU 7 DPC total execution time (s): 0,009457
CPU 7 DPC count: 2205
_________________________________________________________________________________________________________
CPU 8 Interrupt cycle time (s): 24,149745
CPU 8 ISR highest execution time (µs): 0,0
CPU 8 ISR total execution time (s): 0,0
CPU 8 ISR count: 0
CPU 8 DPC highest execution time (µs): 508,568038
CPU 8 DPC total execution time (s): 0,043041
CPU 8 DPC count: 8953
_________________________________________________________________________________________________________
CPU 9 Interrupt cycle time (s): 27,883312
CPU 9 ISR highest execution time (µs): 0,0
CPU 9 ISR total execution time (s): 0,0
CPU 9 ISR count: 0
CPU 9 DPC highest execution time (µs): 119,483650
CPU 9 DPC total execution time (s): 0,004708
CPU 9 DPC count: 1458
_________________________________________________________________________________________________________
CPU 10 Interrupt cycle time (s): 21,158213
CPU 10 ISR highest execution time (µs): 0,0
CPU 10 ISR total execution time (s): 0,0
CPU 10 ISR count: 0
CPU 10 DPC highest execution time (µs): 555,811181
CPU 10 DPC total execution time (s): 0,033437
CPU 10 DPC count: 8217
_________________________________________________________________________________________________________
CPU 11 Interrupt cycle time (s): 25,334346
CPU 11 ISR highest execution time (µs): 0,0
CPU 11 ISR total execution time (s): 0,0
CPU 11 ISR count: 0
CPU 11 DPC highest execution time (µs): 575,984177
CPU 11 DPC total execution time (s): 0,022592
CPU 11 DPC count: 4026
_________________________________________________________________________________________________________
CPU 12 Interrupt cycle time (s): 32,976189
CPU 12 ISR highest execution time (µs): 187,727848
CPU 12 ISR total execution time (s): 0,005546
CPU 12 ISR count: 7007
CPU 12 DPC highest execution time (µs): 577,653481
CPU 12 DPC total execution time (s): 0,040561
CPU 12 DPC count: 7671
_________________________________________________________________________________________________________
CPU 13 Interrupt cycle time (s): 41,850310
CPU 13 ISR highest execution time (µs): 587,232068
CPU 13 ISR total execution time (s): 0,028763
CPU 13 ISR count: 48719
CPU 13 DPC highest execution time (µs): 572,821203
CPU 13 DPC total execution time (s): 0,031102
CPU 13 DPC count: 5338
_________________________________________________________________________________________________________
CPU 14 Interrupt cycle time (s): 13,557214
CPU 14 ISR highest execution time (µs): 3,46730
CPU 14 ISR total execution time (s): 0,000371
CPU 14 ISR count: 491
CPU 14 DPC highest execution time (µs): 587,168776
CPU 14 DPC total execution time (s): 0,020301
CPU 14 DPC count: 4191
_________________________________________________________________________________________________________
CPU 15 Interrupt cycle time (s): 16,383320
CPU 15 ISR highest execution time (µs): 3,996835
CPU 15 ISR total execution time (s): 0,001148
CPU 15 ISR count: 2148
CPU 15 DPC highest execution time (µs): 116,209388
CPU 15 DPC total execution time (s): 0,010286
CPU 15 DPC count: 2475
_________________________________________________________________________________________________________
 
Prova a fare questa prova. Vai in gestione dispositivi e disattiva la scheda di rete nella scheda Proprietà che apri cliccando sopra col tasto destro. Poi avvia Latency moon e vedi la condizione in quel caso
 
Prova a fare questa prova. Vai in gestione dispositivi e disattiva la scheda di rete nella scheda Proprietà che apri cliccando sopra col tasto destro. Poi avvia Latency moon e vedi la condizione in quel caso
Ci siamo !!!

Di seguito il report con scheda di rete disabilitata

_________________________________________________________________________________________________________
CONCLUSION
_________________________________________________________________________________________________________
Your system appears to be suitable for handling real-time audio and other tasks without dropouts.
LatencyMon has been analyzing your system for 0:29:51 (h:mm:ss) on all processors.


_________________________________________________________________________________________________________
SYSTEM INFORMATION
_________________________________________________________________________________________________________
Computer name: DESKTOP-7G6T94E
OS version: Windows 10, 10.0, version 2009, build: 19045 (x64)
Hardware: System Product Name, ASUS
BIOS: 2701
CPU: GenuineIntel Intel(R) Core(TM) i7-10700K CPU @ 3.80GHz
Logical processors: 16
Processor groups: 1
Processor group size: 16
RAM: 32668 MB total


_________________________________________________________________________________________________________
CPU SPEED
_________________________________________________________________________________________________________
Reported CPU speed (WMI): 3792 MHz
Reported CPU speed (registry): 3792 MHz

Note: reported execution times may be calculated based on a fixed reported CPU speed. Disable variable speed settings like Intel Speed Step and AMD Cool N Quiet in the BIOS setup for more accurate results.


_________________________________________________________________________________________________________
MEASURED INTERRUPT TO USER PROCESS LATENCIES
_________________________________________________________________________________________________________
The interrupt to process latency reflects the measured interval that a usermode process needed to respond to a hardware request from the moment the interrupt service routine started execution. This includes the scheduling and execution of a DPC routine, the signaling of an event and the waking up of a usermode thread from an idle wait state in response to that event.

Highest measured interrupt to process latency (µs): 539,90
Average measured interrupt to process latency (µs): 7,970242

Highest measured interrupt to DPC latency (µs): 510,40
Average measured interrupt to DPC latency (µs): 3,428855


_________________________________________________________________________________________________________
REPORTED ISRs
_________________________________________________________________________________________________________
Interrupt service routines are routines installed by the OS and device drivers that execute in response to a hardware interrupt signal.

Highest ISR routine execution time (µs): 530,665612
Driver with highest ISR routine execution time: HDAudBus.sys - High Definition Audio Bus Driver, Microsoft Corporation

Highest reported total ISR routine time (%): 0,001085
Driver with highest ISR total time: HDAudBus.sys - High Definition Audio Bus Driver, Microsoft Corporation

Total time spent in ISRs (%) 0,002072

ISR count (execution time <250 µs): 369303
ISR count (execution time 250-500 µs): 0
ISR count (execution time 500-1000 µs): 1
ISR count (execution time 1000-2000 µs): 0
ISR count (execution time 2000-4000 µs): 0
ISR count (execution time >=4000 µs): 0


_________________________________________________________________________________________________________
REPORTED DPCs
_________________________________________________________________________________________________________
DPC routines are part of the interrupt servicing dispatch mechanism and disable the possibility for a process to utilize the CPU while it is interrupted until the DPC has finished execution.

Highest DPC routine execution time (µs): 843,257911
Driver with highest DPC routine execution time: nvlddmkm.sys - NVIDIA Windows Kernel Mode Driver, Version 536.40 , NVIDIA Corporation

Highest reported total DPC routine time (%): 0,022854
Driver with highest DPC total execution time: nvlddmkm.sys - NVIDIA Windows Kernel Mode Driver, Version 536.40 , NVIDIA Corporation

Total time spent in DPCs (%) 0,062611

DPC count (execution time <250 µs): 1948203
DPC count (execution time 250-500 µs): 0
DPC count (execution time 500-10000 µs): 1116
DPC count (execution time 1000-2000 µs): 0
DPC count (execution time 2000-4000 µs): 0
DPC count (execution time >=4000 µs): 0


_________________________________________________________________________________________________________
REPORTED HARD PAGEFAULTS
_________________________________________________________________________________________________________
Hard pagefaults are events that get triggered by making use of virtual memory that is not resident in RAM but backed by a memory mapped file on disk. The process of resolving the hard pagefault requires reading in the memory from disk while the process is interrupted and blocked from execution.

NOTE: some processes were hit by hard pagefaults. If these were programs producing audio, they are likely to interrupt the audio stream resulting in dropouts, clicks and pops. Check the Processes tab to see which programs were hit.

Process with highest pagefault count: javaw.exe

Total number of hard pagefaults 80543
Hard pagefault count of hardest hit process: 77756
Number of processes hit: 12


_________________________________________________________________________________________________________
PER CPU DATA
_________________________________________________________________________________________________________
CPU 0 Interrupt cycle time (s): 65,375063
CPU 0 ISR highest execution time (µs): 530,665612
CPU 0 ISR total execution time (s): 0,547242
CPU 0 ISR count: 298778
CPU 0 DPC highest execution time (µs): 843,257911
CPU 0 DPC total execution time (s): 17,204438
CPU 0 DPC count: 1656966
_________________________________________________________________________________________________________
CPU 1 Interrupt cycle time (s): 7,851351
CPU 1 ISR highest execution time (µs): 25,038502
CPU 1 ISR total execution time (s): 0,004345
CPU 1 ISR count: 3651
CPU 1 DPC highest execution time (µs): 596,315401
CPU 1 DPC total execution time (s): 0,098172
CPU 1 DPC count: 7711
_________________________________________________________________________________________________________
CPU 2 Interrupt cycle time (s): 8,784879
CPU 2 ISR highest execution time (µs): 0,0
CPU 2 ISR total execution time (s): 0,0
CPU 2 ISR count: 0
CPU 2 DPC highest execution time (µs): 377,910865
CPU 2 DPC total execution time (s): 0,115224
CPU 2 DPC count: 50847
_________________________________________________________________________________________________________
CPU 3 Interrupt cycle time (s): 7,167036
CPU 3 ISR highest execution time (µs): 0,0
CPU 3 ISR total execution time (s): 0,0
CPU 3 ISR count: 0
CPU 3 DPC highest execution time (µs): 377,925105
CPU 3 DPC total execution time (s): 0,010313
CPU 3 DPC count: 3143
_________________________________________________________________________________________________________
CPU 4 Interrupt cycle time (s): 8,361658
CPU 4 ISR highest execution time (µs): 0,0
CPU 4 ISR total execution time (s): 0,0
CPU 4 ISR count: 0
CPU 4 DPC highest execution time (µs): 539,869726
CPU 4 DPC total execution time (s): 0,067358
CPU 4 DPC count: 24743
_________________________________________________________________________________________________________
CPU 5 Interrupt cycle time (s): 7,645432
CPU 5 ISR highest execution time (µs): 0,0
CPU 5 ISR total execution time (s): 0,0
CPU 5 ISR count: 0
CPU 5 DPC highest execution time (µs): 131,59230
CPU 5 DPC total execution time (s): 0,010922
CPU 5 DPC count: 3020
_________________________________________________________________________________________________________
CPU 6 Interrupt cycle time (s): 6,831636
CPU 6 ISR highest execution time (µs): 0,0
CPU 6 ISR total execution time (s): 0,0
CPU 6 ISR count: 0
CPU 6 DPC highest execution time (µs): 125,127637
CPU 6 DPC total execution time (s): 0,041261
CPU 6 DPC count: 18323
_________________________________________________________________________________________________________
CPU 7 Interrupt cycle time (s): 5,741401
CPU 7 ISR highest execution time (µs): 0,0
CPU 7 ISR total execution time (s): 0,0
CPU 7 ISR count: 0
CPU 7 DPC highest execution time (µs): 128,486287
CPU 7 DPC total execution time (s): 0,004560
CPU 7 DPC count: 1791
_________________________________________________________________________________________________________
CPU 8 Interrupt cycle time (s): 6,216513
CPU 8 ISR highest execution time (µs): 0,0
CPU 8 ISR total execution time (s): 0,0
CPU 8 ISR count: 0
CPU 8 DPC highest execution time (µs): 409,040084
CPU 8 DPC total execution time (s): 0,047123
CPU 8 DPC count: 20716
_________________________________________________________________________________________________________
CPU 9 Interrupt cycle time (s): 5,548123
CPU 9 ISR highest execution time (µs): 0,0
CPU 9 ISR total execution time (s): 0,0
CPU 9 ISR count: 0
CPU 9 DPC highest execution time (µs): 409,863397
CPU 9 DPC total execution time (s): 0,014050
CPU 9 DPC count: 4520
_________________________________________________________________________________________________________
CPU 10 Interrupt cycle time (s): 6,066071
CPU 10 ISR highest execution time (µs): 0,0
CPU 10 ISR total execution time (s): 0,0
CPU 10 ISR count: 0
CPU 10 DPC highest execution time (µs): 515,854958
CPU 10 DPC total execution time (s): 0,038056
CPU 10 DPC count: 17769
_________________________________________________________________________________________________________
CPU 11 Interrupt cycle time (s): 5,509126
CPU 11 ISR highest execution time (µs): 0,0
CPU 11 ISR total execution time (s): 0,0
CPU 11 ISR count: 0
CPU 11 DPC highest execution time (µs): 81,077532
CPU 11 DPC total execution time (s): 0,008049
CPU 11 DPC count: 2817
_________________________________________________________________________________________________________
CPU 12 Interrupt cycle time (s): 7,277762
CPU 12 ISR highest execution time (µs): 19,136603
CPU 12 ISR total execution time (s): 0,008503
CPU 12 ISR count: 10286
CPU 12 DPC highest execution time (µs): 138,074895
CPU 12 DPC total execution time (s): 0,185956
CPU 12 DPC count: 104682
_________________________________________________________________________________________________________
CPU 13 Interrupt cycle time (s): 7,931857
CPU 13 ISR highest execution time (µs): 84,617616
CPU 13 ISR total execution time (s): 0,031245
CPU 13 ISR count: 52945
CPU 13 DPC highest execution time (µs): 561,349156
CPU 13 DPC total execution time (s): 0,035158
CPU 13 DPC count: 7201
_________________________________________________________________________________________________________
CPU 14 Interrupt cycle time (s): 6,220060
CPU 14 ISR highest execution time (µs): 54,270570
CPU 14 ISR total execution time (s): 0,001024
CPU 14 ISR count: 1339
CPU 14 DPC highest execution time (µs): 118,026371
CPU 14 DPC total execution time (s): 0,052402
CPU 14 DPC count: 22995
_________________________________________________________________________________________________________
CPU 15 Interrupt cycle time (s): 5,867472
CPU 15 ISR highest execution time (µs): 3,958333
CPU 15 ISR total execution time (s): 0,001334
CPU 15 ISR count: 2305
CPU 15 DPC highest execution time (µs): 274,359177
CPU 15 DPC total execution time (s): 0,010594
CPU 15 DPC count: 2075
_________________________________________________________________________________________________________
Ecco il problema. La scheda di rete.
Scarica questi e scompattali avviando prima l'utility di update del firmware e dopo riavvia il pc e fai l'update dei driver:
 
Ecco il problema. La scheda di rete.
Scarica questi e scompattali avviando prima l'utility di update del firmware e dopo riavvia il pc e fai l'update dei driver:

Ho scaricato il file ed installato prima il firmware, spento completamente il pc, riavviato ed installato i driver, riavviato nuovamente ma si verifica ancora il problema. Nell'installazione dei driver mi si apre una schermata nera per qualche istante con 2 stringhe di comandi e si chiude da sola, è normale faccia così o sbaglio qualcosa? Di seguito il test eseguito dopo aver eseguito il processo una prima volta.

_________________________________________________________________________________________________________
CONCLUSION
_________________________________________________________________________________________________________
Your system seems to be having difficulty handling real-time audio and other tasks. You may experience drop outs, clicks or pops due to buffer underruns. One or more DPC routines that belong to a driver running in your system appear to be executing for too long. One problem may be related to power management, disable CPU throttling settings in Control Panel and BIOS setup. Check for BIOS updates.
LatencyMon has been analyzing your system for 0:32:12 (h:mm:ss) on all processors.


_________________________________________________________________________________________________________
SYSTEM INFORMATION
_________________________________________________________________________________________________________
Computer name: DESKTOP-7G6T94E
OS version: Windows 10, 10.0, version 2009, build: 19045 (x64)
Hardware: System Product Name, ASUS
BIOS: 2701
CPU: GenuineIntel Intel(R) Core(TM) i7-10700K CPU @ 3.80GHz
Logical processors: 16
Processor groups: 1
Processor group size: 16
RAM: 32668 MB total


_________________________________________________________________________________________________________
CPU SPEED
_________________________________________________________________________________________________________
Reported CPU speed (WMI): 3792 MHz
Reported CPU speed (registry): 3792 MHz

Note: reported execution times may be calculated based on a fixed reported CPU speed. Disable variable speed settings like Intel Speed Step and AMD Cool N Quiet in the BIOS setup for more accurate results.


_________________________________________________________________________________________________________
MEASURED INTERRUPT TO USER PROCESS LATENCIES
_________________________________________________________________________________________________________
The interrupt to process latency reflects the measured interval that a usermode process needed to respond to a hardware request from the moment the interrupt service routine started execution. This includes the scheduling and execution of a DPC routine, the signaling of an event and the waking up of a usermode thread from an idle wait state in response to that event.

Highest measured interrupt to process latency (µs): 1203,10
Average measured interrupt to process latency (µs): 10,119860

Highest measured interrupt to DPC latency (µs): 560,80
Average measured interrupt to DPC latency (µs): 2,956898


_________________________________________________________________________________________________________
REPORTED ISRs
_________________________________________________________________________________________________________
Interrupt service routines are routines installed by the OS and device drivers that execute in response to a hardware interrupt signal.

Highest ISR routine execution time (µs): 579,604430
Driver with highest ISR routine execution time: Wdf01000.sys - Runtime framework driver modalità kernel, Microsoft Corporation

Highest reported total ISR routine time (%): 0,000962
Driver with highest ISR total time: Wdf01000.sys - Runtime framework driver modalità kernel, Microsoft Corporation

Total time spent in ISRs (%) 0,001780

ISR count (execution time <250 µs): 389727
ISR count (execution time 250-500 µs): 0
ISR count (execution time 500-1000 µs): 4
ISR count (execution time 1000-2000 µs): 0
ISR count (execution time 2000-4000 µs): 0
ISR count (execution time >=4000 µs): 0


_________________________________________________________________________________________________________
REPORTED DPCs
_________________________________________________________________________________________________________
DPC routines are part of the interrupt servicing dispatch mechanism and disable the possibility for a process to utilize the CPU while it is interrupted until the DPC has finished execution.

Highest DPC routine execution time (µs): 1194,327004
Driver with highest DPC routine execution time: Wdf01000.sys - Runtime framework driver modalità kernel, Microsoft Corporation

Highest reported total DPC routine time (%): 0,027119
Driver with highest DPC total execution time: nvlddmkm.sys - NVIDIA Windows Kernel Mode Driver, Version 536.40 , NVIDIA Corporation

Total time spent in DPCs (%) 0,072582

DPC count (execution time <250 µs): 2481928
DPC count (execution time 250-500 µs): 0
DPC count (execution time 500-10000 µs): 1689
DPC count (execution time 1000-2000 µs): 106
DPC count (execution time 2000-4000 µs): 0
DPC count (execution time >=4000 µs): 0


_________________________________________________________________________________________________________
REPORTED HARD PAGEFAULTS
_________________________________________________________________________________________________________
Hard pagefaults are events that get triggered by making use of virtual memory that is not resident in RAM but backed by a memory mapped file on disk. The process of resolving the hard pagefault requires reading in the memory from disk while the process is interrupted and blocked from execution.

NOTE: some processes were hit by hard pagefaults. If these were programs producing audio, they are likely to interrupt the audio stream resulting in dropouts, clicks and pops. Check the Processes tab to see which programs were hit.

Process with highest pagefault count: steam.exe

Total number of hard pagefaults 21183
Hard pagefault count of hardest hit process: 4740
Number of processes hit: 56


_________________________________________________________________________________________________________
PER CPU DATA
_________________________________________________________________________________________________________
CPU 0 Interrupt cycle time (s): 99,486501
CPU 0 ISR highest execution time (µs): 579,604430
CPU 0 ISR total execution time (s): 0,485983
CPU 0 ISR count: 314383
CPU 0 DPC highest execution time (µs): 1194,327004
CPU 0 DPC total execution time (s): 21,735810
CPU 0 DPC count: 2364226
_________________________________________________________________________________________________________
CPU 1 Interrupt cycle time (s): 42,371304
CPU 1 ISR highest execution time (µs): 56,177743
CPU 1 ISR total execution time (s): 0,015829
CPU 1 ISR count: 8886
CPU 1 DPC highest execution time (µs): 579,650316
CPU 1 DPC total execution time (s): 0,221678
CPU 1 DPC count: 12767
_________________________________________________________________________________________________________
CPU 2 Interrupt cycle time (s): 31,620428
CPU 2 ISR highest execution time (µs): 26,196730
CPU 2 ISR total execution time (s): 0,004374
CPU 2 ISR count: 694
CPU 2 DPC highest execution time (µs): 996,849156
CPU 2 DPC total execution time (s): 0,085045
CPU 2 DPC count: 30052
_________________________________________________________________________________________________________
CPU 3 Interrupt cycle time (s): 35,910199
CPU 3 ISR highest execution time (µs): 0,0
CPU 3 ISR total execution time (s): 0,0
CPU 3 ISR count: 0
CPU 3 DPC highest execution time (µs): 588,398207
CPU 3 DPC total execution time (s): 0,013758
CPU 3 DPC count: 3644
_________________________________________________________________________________________________________
CPU 4 Interrupt cycle time (s): 36,036234
CPU 4 ISR highest execution time (µs): 0,0
CPU 4 ISR total execution time (s): 0,0
CPU 4 ISR count: 0
CPU 4 DPC highest execution time (µs): 242,266878
CPU 4 DPC total execution time (s): 0,057097
CPU 4 DPC count: 11267
_________________________________________________________________________________________________________
CPU 5 Interrupt cycle time (s): 38,183733
CPU 5 ISR highest execution time (µs): 0,0
CPU 5 ISR total execution time (s): 0,0
CPU 5 ISR count: 0
CPU 5 DPC highest execution time (µs): 135,748945
CPU 5 DPC total execution time (s): 0,003630
CPU 5 DPC count: 1032
_________________________________________________________________________________________________________
CPU 6 Interrupt cycle time (s): 65,449654
CPU 6 ISR highest execution time (µs): 0,0
CPU 6 ISR total execution time (s): 0,0
CPU 6 ISR count: 0
CPU 6 DPC highest execution time (µs): 532,521624
CPU 6 DPC total execution time (s): 0,039591
CPU 6 DPC count: 8552
_________________________________________________________________________________________________________
CPU 7 Interrupt cycle time (s): 52,442729
CPU 7 ISR highest execution time (µs): 0,0
CPU 7 ISR total execution time (s): 0,0
CPU 7 ISR count: 0
CPU 7 DPC highest execution time (µs): 558,583861
CPU 7 DPC total execution time (s): 0,030970
CPU 7 DPC count: 4639
_________________________________________________________________________________________________________
CPU 8 Interrupt cycle time (s): 36,263772
CPU 8 ISR highest execution time (µs): 0,0
CPU 8 ISR total execution time (s): 0,0
CPU 8 ISR count: 0
CPU 8 DPC highest execution time (µs): 584,423523
CPU 8 DPC total execution time (s): 0,053521
CPU 8 DPC count: 8039
_________________________________________________________________________________________________________
CPU 9 Interrupt cycle time (s): 48,315218
CPU 9 ISR highest execution time (µs): 0,0
CPU 9 ISR total execution time (s): 0,0
CPU 9 ISR count: 0
CPU 9 DPC highest execution time (µs): 88,165612
CPU 9 DPC total execution time (s): 0,006155
CPU 9 DPC count: 2643
_________________________________________________________________________________________________________
CPU 10 Interrupt cycle time (s): 31,346916
CPU 10 ISR highest execution time (µs): 0,0
CPU 10 ISR total execution time (s): 0,0
CPU 10 ISR count: 0
CPU 10 DPC highest execution time (µs): 572,090190
CPU 10 DPC total execution time (s): 0,029854
CPU 10 DPC count: 7237
_________________________________________________________________________________________________________
CPU 11 Interrupt cycle time (s): 41,785452
CPU 11 ISR highest execution time (µs): 0,0
CPU 11 ISR total execution time (s): 0,0
CPU 11 ISR count: 0
CPU 11 DPC highest execution time (µs): 372,058544
CPU 11 DPC total execution time (s): 0,061097
CPU 11 DPC count: 9470
_________________________________________________________________________________________________________
CPU 12 Interrupt cycle time (s): 31,433356
CPU 12 ISR highest execution time (µs): 69,525316
CPU 12 ISR total execution time (s): 0,004833
CPU 12 ISR count: 6281
CPU 12 DPC highest execution time (µs): 565,285865
CPU 12 DPC total execution time (s): 0,033593
CPU 12 DPC count: 7415
_________________________________________________________________________________________________________
CPU 13 Interrupt cycle time (s): 42,859378
CPU 13 ISR highest execution time (µs): 559,736814
CPU 13 ISR total execution time (s): 0,036382
CPU 13 ISR count: 54605
CPU 13 DPC highest execution time (µs): 561,940401
CPU 13 DPC total execution time (s): 0,026559
CPU 13 DPC count: 5111
_________________________________________________________________________________________________________
CPU 14 Interrupt cycle time (s): 21,846308
CPU 14 ISR highest execution time (µs): 85,933017
CPU 14 ISR total execution time (s): 0,000905
CPU 14 ISR count: 1211
CPU 14 DPC highest execution time (µs): 387,286920
CPU 14 DPC total execution time (s): 0,025896
CPU 14 DPC count: 5185
_________________________________________________________________________________________________________
CPU 15 Interrupt cycle time (s): 27,265175
CPU 15 ISR highest execution time (µs): 41,600211
CPU 15 ISR total execution time (s): 0,002125
CPU 15 ISR count: 3671
CPU 15 DPC highest execution time (µs): 150,525844
CPU 15 DPC total execution time (s): 0,014435
CPU 15 DPC count: 2444
_________________________________________________________________________________________________________

P.S. per scrupolo ho provato a rieseguire il processo ma mi segnala il medesimo errore...
 
Prova scaricando questa versione e aggiorna il driver della scheda di rete:
Comunque è un problema di quel chip di rete assieme al I226 conosciuto che è in via di risoluzione con versioni dedicate dei driver ma probabilmente si tratta di un bug hardware. L'alternativa è un'altra scheda di rete PCI-e disattivando quella sulla scheda madre
 
Ultima modifica:
Prova scaricando questa versione e aggiorna il driver della scheda di rete:
Comunque è un problema di quel chip di rete assieme al I226 conosciuto che è in via di risoluzione con versioni dedicate dei driver ma probabilmente si tratta di un bug hardware. L'alternativa è un'altra scheda di rete PCI-e disattivando quella sulla scheda madre

Cavolo.... bel problema...
Quindi dovrei aggiungere una nuova scheda di rete?
La porta PCI-e libera è attaccata alla scheda video, non c'è altra soluzione? Scrivendo direttamente ad Asus potrebbero supportarmi con la creazione di un Driver "su misura" secondo te?

Per non perdere l'abitudine di seguito l'ultimo test..

_________________________________________________________________________________________________________

CONCLUSION
_________________________________________________________________________________________________________
Your system appears to be having trouble handling real-time audio and other tasks. You are likely to experience buffer underruns appearing as drop outs, clicks or pops. One or more DPC routines that belong to a driver running in your system appear to be executing for too long. One problem may be related to power management, disable CPU throttling settings in Control Panel and BIOS setup. Check for BIOS updates.
LatencyMon has been analyzing your system for 0:13:06 (h:mm:ss) on all processors.


_________________________________________________________________________________________________________
SYSTEM INFORMATION
_________________________________________________________________________________________________________
Computer name: DESKTOP-7G6T94E
OS version: Windows 10, 10.0, version 2009, build: 19045 (x64)
Hardware: System Product Name, ASUS
BIOS: 2701
CPU: GenuineIntel Intel(R) Core(TM) i7-10700K CPU @ 3.80GHz
Logical processors: 16
Processor groups: 1
Processor group size: 16
RAM: 32668 MB total


_________________________________________________________________________________________________________
CPU SPEED
_________________________________________________________________________________________________________
Reported CPU speed (WMI): 3792 MHz
Reported CPU speed (registry): 3792 MHz

Note: reported execution times may be calculated based on a fixed reported CPU speed. Disable variable speed settings like Intel Speed Step and AMD Cool N Quiet in the BIOS setup for more accurate results.


_________________________________________________________________________________________________________
MEASURED INTERRUPT TO USER PROCESS LATENCIES
_________________________________________________________________________________________________________
The interrupt to process latency reflects the measured interval that a usermode process needed to respond to a hardware request from the moment the interrupt service routine started execution. This includes the scheduling and execution of a DPC routine, the signaling of an event and the waking up of a usermode thread from an idle wait state in response to that event.

Highest measured interrupt to process latency (µs): 32819,10
Average measured interrupt to process latency (µs): 5,720803

Highest measured interrupt to DPC latency (µs): 32816,40
Average measured interrupt to DPC latency (µs): 3,372455


_________________________________________________________________________________________________________
REPORTED ISRs
_________________________________________________________________________________________________________
Interrupt service routines are routines installed by the OS and device drivers that execute in response to a hardware interrupt signal.

Highest ISR routine execution time (µs): 455,587025
Driver with highest ISR routine execution time: Wdf01000.sys - Runtime framework driver modalità kernel, Microsoft Corporation

Highest reported total ISR routine time (%): 0,002113
Driver with highest ISR total time: Wdf01000.sys - Runtime framework driver modalità kernel, Microsoft Corporation

Total time spent in ISRs (%) 0,002664

ISR count (execution time <250 µs): 332492
ISR count (execution time 250-500 µs): 0
ISR count (execution time 500-1000 µs): 3
ISR count (execution time 1000-2000 µs): 0
ISR count (execution time 2000-4000 µs): 0
ISR count (execution time >=4000 µs): 0


_________________________________________________________________________________________________________
REPORTED DPCs
_________________________________________________________________________________________________________
DPC routines are part of the interrupt servicing dispatch mechanism and disable the possibility for a process to utilize the CPU while it is interrupted until the DPC has finished execution.

Highest DPC routine execution time (µs): 1053,389241
Driver with highest DPC routine execution time: Wdf01000.sys - Runtime framework driver modalità kernel, Microsoft Corporation

Highest reported total DPC routine time (%): 0,057020
Driver with highest DPC total execution time: Wdf01000.sys - Runtime framework driver modalità kernel, Microsoft Corporation

Total time spent in DPCs (%) 0,146419

DPC count (execution time <250 µs): 1293897
DPC count (execution time 250-500 µs): 0
DPC count (execution time 500-10000 µs): 195
DPC count (execution time 1000-2000 µs): 1
DPC count (execution time 2000-4000 µs): 0
DPC count (execution time >=4000 µs): 0


_________________________________________________________________________________________________________
REPORTED HARD PAGEFAULTS
_________________________________________________________________________________________________________
Hard pagefaults are events that get triggered by making use of virtual memory that is not resident in RAM but backed by a memory mapped file on disk. The process of resolving the hard pagefault requires reading in the memory from disk while the process is interrupted and blocked from execution.

NOTE: some processes were hit by hard pagefaults. If these were programs producing audio, they are likely to interrupt the audio stream resulting in dropouts, clicks and pops. Check the Processes tab to see which programs were hit.

Process with highest pagefault count: msmpeng.exe

Total number of hard pagefaults 168
Hard pagefault count of hardest hit process: 92
Number of processes hit: 16


_________________________________________________________________________________________________________
PER CPU DATA
_________________________________________________________________________________________________________
CPU 0 Interrupt cycle time (s): 43,516806
CPU 0 ISR highest execution time (µs): 455,587025
CPU 0 ISR total execution time (s): 0,086975
CPU 0 ISR count: 85569
CPU 0 DPC highest execution time (µs): 1053,389241
CPU 0 DPC total execution time (s): 12,634752
CPU 0 DPC count: 1059112
_________________________________________________________________________________________________________
CPU 1 Interrupt cycle time (s): 25,277102
CPU 1 ISR highest execution time (µs): 27,049051
CPU 1 ISR total execution time (s): 0,181663
CPU 1 ISR count: 142584
CPU 1 DPC highest execution time (µs): 589,487869
CPU 1 DPC total execution time (s): 5,327068
CPU 1 DPC count: 152747
_________________________________________________________________________________________________________
CPU 2 Interrupt cycle time (s): 9,038847
CPU 2 ISR highest execution time (µs): 22,800105
CPU 2 ISR total execution time (s): 0,000111
CPU 2 ISR count: 14
CPU 2 DPC highest execution time (µs): 619,210443
CPU 2 DPC total execution time (s): 0,022102
CPU 2 DPC count: 5623
_________________________________________________________________________________________________________
CPU 3 Interrupt cycle time (s): 12,971222
CPU 3 ISR highest execution time (µs): 0,0
CPU 3 ISR total execution time (s): 0,0
CPU 3 ISR count: 0
CPU 3 DPC highest execution time (µs): 268,798523
CPU 3 DPC total execution time (s): 0,063644
CPU 3 DPC count: 7199
_________________________________________________________________________________________________________
CPU 4 Interrupt cycle time (s): 9,083921
CPU 4 ISR highest execution time (µs): 0,0
CPU 4 ISR total execution time (s): 0,0
CPU 4 ISR count: 0
CPU 4 DPC highest execution time (µs): 575,405591
CPU 4 DPC total execution time (s): 0,021533
CPU 4 DPC count: 4645
_________________________________________________________________________________________________________
CPU 5 Interrupt cycle time (s): 9,128566
CPU 5 ISR highest execution time (µs): 0,0
CPU 5 ISR total execution time (s): 0,0
CPU 5 ISR count: 0
CPU 5 DPC highest execution time (µs): 59,116561
CPU 5 DPC total execution time (s): 0,003040
CPU 5 DPC count: 1118
_________________________________________________________________________________________________________
CPU 6 Interrupt cycle time (s): 9,733671
CPU 6 ISR highest execution time (µs): 0,0
CPU 6 ISR total execution time (s): 0,0
CPU 6 ISR count: 0
CPU 6 DPC highest execution time (µs): 89,559072
CPU 6 DPC total execution time (s): 0,012684
CPU 6 DPC count: 3359
_________________________________________________________________________________________________________
CPU 7 Interrupt cycle time (s): 9,675959
CPU 7 ISR highest execution time (µs): 0,0
CPU 7 ISR total execution time (s): 0,0
CPU 7 ISR count: 0
CPU 7 DPC highest execution time (µs): 118,631857
CPU 7 DPC total execution time (s): 0,006032
CPU 7 DPC count: 1591
_________________________________________________________________________________________________________
CPU 8 Interrupt cycle time (s): 7,729404
CPU 8 ISR highest execution time (µs): 0,0
CPU 8 ISR total execution time (s): 0,0
CPU 8 ISR count: 0
CPU 8 DPC highest execution time (µs): 586,71730
CPU 8 DPC total execution time (s): 0,022368
CPU 8 DPC count: 4866
_________________________________________________________________________________________________________
CPU 9 Interrupt cycle time (s): 8,498447
CPU 9 ISR highest execution time (µs): 0,0
CPU 9 ISR total execution time (s): 0,0
CPU 9 ISR count: 0
CPU 9 DPC highest execution time (µs): 90,991561
CPU 9 DPC total execution time (s): 0,006684
CPU 9 DPC count: 2129
_________________________________________________________________________________________________________
CPU 10 Interrupt cycle time (s): 8,302709
CPU 10 ISR highest execution time (µs): 0,0
CPU 10 ISR total execution time (s): 0,0
CPU 10 ISR count: 0
CPU 10 DPC highest execution time (µs): 561,844409
CPU 10 DPC total execution time (s): 0,013595
CPU 10 DPC count: 2849
_________________________________________________________________________________________________________
CPU 11 Interrupt cycle time (s): 8,956855
CPU 11 ISR highest execution time (µs): 0,0
CPU 11 ISR total execution time (s): 0,0
CPU 11 ISR count: 0
CPU 11 DPC highest execution time (µs): 549,872363
CPU 11 DPC total execution time (s): 0,016825
CPU 11 DPC count: 3870
_________________________________________________________________________________________________________
CPU 12 Interrupt cycle time (s): 9,93720
CPU 12 ISR highest execution time (µs): 28,685654
CPU 12 ISR total execution time (s): 0,045956
CPU 12 ISR count: 64394
CPU 12 DPC highest execution time (µs): 561,687236
CPU 12 DPC total execution time (s): 0,173053
CPU 12 DPC count: 28257
_________________________________________________________________________________________________________
CPU 13 Interrupt cycle time (s): 9,773826
CPU 13 ISR highest execution time (µs): 119,420886
CPU 13 ISR total execution time (s): 0,016037
CPU 13 ISR count: 32290
CPU 13 DPC highest execution time (µs): 138,886076
CPU 13 DPC total execution time (s): 0,036741
CPU 13 DPC count: 7864
_________________________________________________________________________________________________________
CPU 14 Interrupt cycle time (s): 7,754751
CPU 14 ISR highest execution time (µs): 3,474684
CPU 14 ISR total execution time (s): 0,000889
CPU 14 ISR count: 1007
CPU 14 DPC highest execution time (µs): 582,795886
CPU 14 DPC total execution time (s): 0,030235
CPU 14 DPC count: 4589
_________________________________________________________________________________________________________
CPU 15 Interrupt cycle time (s): 8,220689
CPU 15 ISR highest execution time (µs): 5,242089
CPU 15 ISR total execution time (s): 0,003486
CPU 15 ISR count: 6637
CPU 15 DPC highest execution time (µs): 558,327532
CPU 15 DPC total execution time (s): 0,028416
CPU 15 DPC count: 4275
_________________________________________________________________________________________________________
Per la scheda di rete devi utilizzare l'ultimo slot in basso della scheda madre.
 
Pubblicità
Pubblicità
Indietro
Top